
A robust urban tree canopy provides myriad benefits ranging across environmental, economic, and social spectra, and is essential to the health of the city of Tacoma. Metro Parks Tacoma (MPT) manages the majority of Tacoma’s urban forest and is actively working to increase overall tree canopy coverage in its parks to 66 percent by the year 2030. Midway through their 20-year Tree Canopy Cover Plan, MPT asked the University of Washington Tacoma to analyze raw data with four goals:
1. Measure the change in tree canopy coverage over time to verify that the Tree Canopy Cover Plan is on track.
2. Identify areas of most and least tree canopy growth over time.
3. Identify areas that could rapidly increase the tree canopy.
4. Ensure all of Tacoma's residents are benefiting equitably.
The full research paper can be found here.

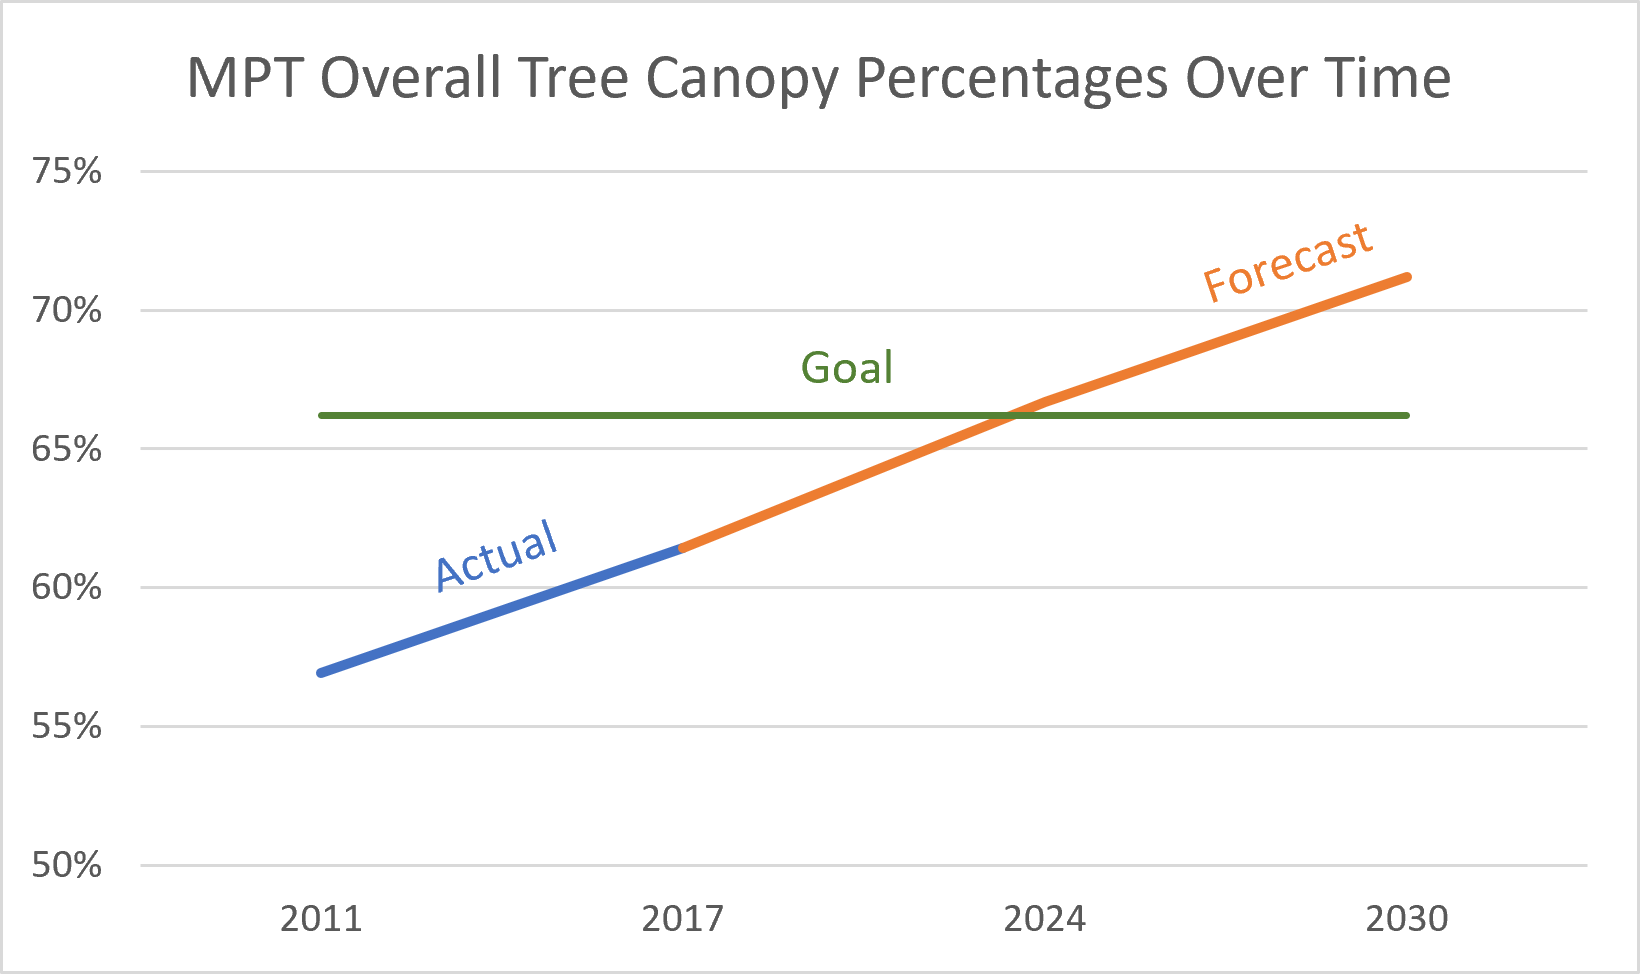
The overall tree canopy cover for Metro Parks Tacoma’s properties was 61.42 percent in 2017. This is up from 56.91 percent in 2011 and represents an annual increase of 0.75 percent. Applying that growth rate over 19 years predicts the tree canopy cover will surpass the plan’s goal of 66 percent by the year 2024, years ahead of schedule.
While only two observations are a poor basis for establishing a trend, it is reassuring to see such a strong start to the Tree Canopy Cover Plan.
Additional details are available on the Tables tab.
Areas of most and least growth are identified in each of Metro Parks Tacoma's 84 parks. Each park has a linear forecast of its tree canopy cover percentage for the year 2030 based on its annual growth rate observed during the study. Comparing each park’s forecast to goal percentages, 24 parks will not reach their targets. The shortage for these parks is listed in acres on the tables, allowing Metro Parks Tacoma’s arborist to concentrate on larger areas, if appropriate.
However, the total shortage equates to only 1.26 percent of the portfolio studied.
Details are available on the Tables tab.
The healthier areas (shown in green) of the NDVI analysis are prime targets for accelerating tree canopy growth in parks not forecasted to reach their goals. Very healthy and moderately healthy areas not already planted with maturing trees are the best zones to consider new tree growth. With additional support, unhealthy zones (shown in orange) can very quickly increase tree canopy cover over previously bare or shrubby terrain. Inanimate areas (shown in red) are poor choices for increasing tree canopy cover due to the cost of removing impervious surfaces or draining ponds.
Visual surveys of areas for quick tree canopy growth are available on the Map tab.

Among other benefits, research shows that increased tree canopy coverage moderates temperatures year-round, reduces pollution and storm water runoff waste, increases real estate and economic value, and improves mental and physical health of the community. Tacoma’s Equity/Opportunity Index is one of the primary tools that city staff, community members, partners, and other decision-makers use to improve access to opportunities for all Tacoma residents. The Index highlights successes and obstacles connected to accessibility, livability, education, economy, and environmental health.
HI Equity/Opportunity represents locations that have access to better opportunities to succeed and excel in life. The indicators include high-performing schools, access to adequate transportation, safe neighborhoods, and sustainable employment. In contrast, LO Equity/Opportunity communities have more obstacles and barriers. These neighborhoods have limited access to institutional or societal investments which limits their quality of life.
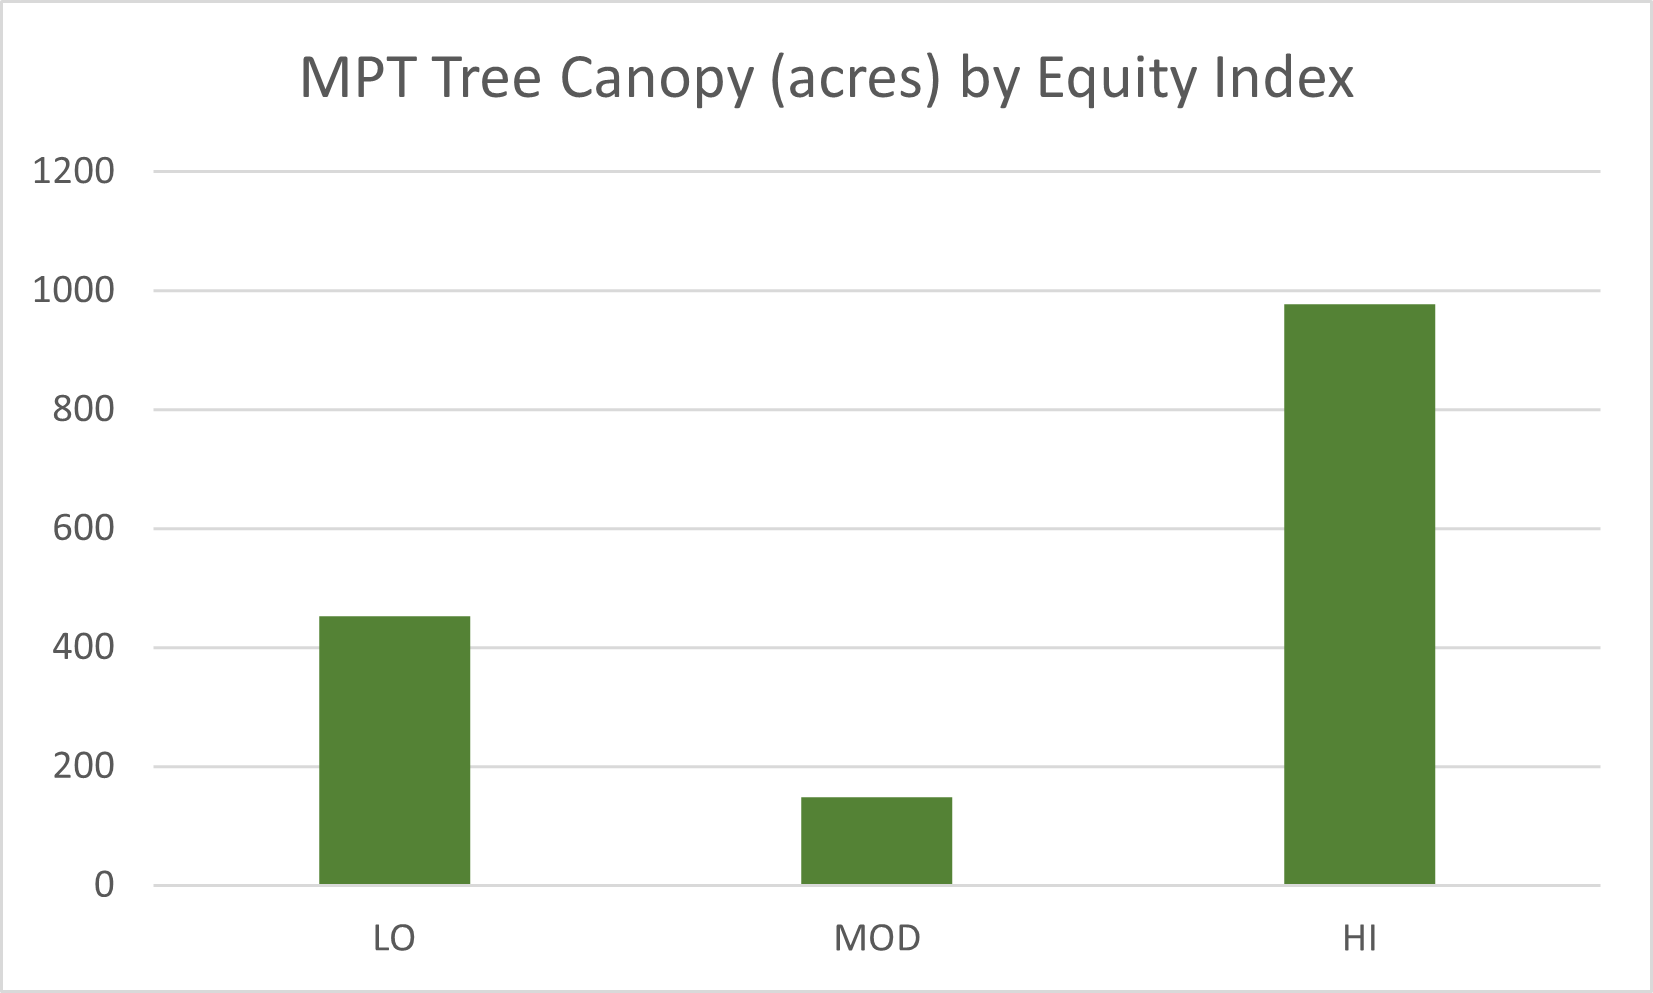
Despite having a lower overall population, HI neighborhoods enjoy twice the tree canopy coverage area than LO neighborhoods. This results from a combination of more parks with more overall space and higher tree canopy cover percentages in the HI neighborhoods as compared to LO neighborhoods.
Additional details are available on the Tables tab.
Primary data for this study were Light Detection and Ranging (LiDAR) and 4-band National Agriculture Imagery Program (NAIP) aerial imagery. Both sets of data came from the years 2011 and 2017. ArcGIS Pro was used to conduct analyses and create shapefiles. Leaflet was used to display results on this site.
The red and near-infrared bands of the NAIP imagery were used to develop Normalized Difference Vegetation Index (NDVI) analyses of the parks. The NDVI classified land as healthy or inanimate. Inanimate land and building footprints were used to mask LiDAR analysis to living vegetation within park boundaries. The LiDAR data identified everything that was eight feet tall or taller to create the tree canopy cover shapefile. By comparing the results from 2011 and 2017, it was posible to identify the percentages of tree canopy cover for each year and extrapolate an annual growth rate. This was broken down to each park.
NDVI analysis also provides clues for Metro Parks Tacoma to rapidly grow more tree canopy. The healthier areas on the map are prime areas for exploring new growth.
To incorporate the Equity Index, parks were identified by which of three Equity Index neighborhoods they intersected. Parks that spanned more than one Equity Index neighborhood were counted in both. For clarity, the Equity/Opportunity Index's quintiles (very high, high, moderate, low, and very low) were reduced to three categories: HI, MOD, and LO. HI represents the high and very high neighborhoods. LO represents the low and very low neighborhoods. MOD remains a 20 percent buffer in between. Specific findings are available on the Tables tab.
For a detailed acount of this study, the full research paper can be found here.

An ArcGIS Pro model is available for future analysis of the Metro Parks Tacoma tree canopy cover. When the city of Tacoma conducts future urban forest canopy assessments for their 30-by-30 Initiative, they will provide a shapefile of the city-wide tree canopy cover. Using that shapefile and a current parks boundaries shapefile, a user may quickly create an updated tree canopy feature class (with an accompanying Excel spreadsheet) to compare with the 2011 and 2017 analyses.
Special thanks to Renee Opatz at Metro Parks Tacoma, and Dr. Emma Slager and Dr. Jim Thatcher at the University of Washington Tacoma.
NAIP data came from the USGS Earth Explorer.
LiDAR data came from Washington State DNR LiDAR Portal.
Equity/Opportunity Index data came from the City of Tacoma GeoHub Portal.
Population data came from the U.S. Census Bureau.